Getting Started with Google Analytics
- Completion time About 25 minutes

Now that you have your website up and ready to generate business, it’s time to track your traffic. Google Analytics can be intimidating at first, but it is the best tool for understanding what’s working on your site – and what isn’t.
Below, we’ll cover what data you should be looking at to ensure your website is performing well.
Tracking Traffic
Understanding where your traffic is coming from and which keywords are working is essential for entrepreneurs with little ime on their hands. When you know where to focus your energy and money, you’ll be able to grow your traffic efficiently.
Discovering channel drivers
Understanding which channels are sending you traffic is helpful in deciding which areas you should throw money at, and which campaigns aren’t working. To find your top traffic channels, from the dashboard, follow the instructions below:
- Acquisition
- All Traffic
- Channels

Once you click channels, you’ll be able to see which channels are driving traffic. It will either be:
- Organic Search: Traffic driven by search engines.
- Referral: Traffic driven by external sources outside your site, excluding search engines. Typically, traffic sent to your site from another site linking to your content.
- Direct: Traffic sent to your site from someone typing your website into their browser or clicking your website from an existing bookmark. In other words, the visitor knew which page they wanted to go to, and got there on their own.
- Paid Search: Traffic sent to your site from campaigns you paid for. This can include PPC campaigns, social campaigns or third-party campaigns.
- Display: traffic from display advertising and campaigns, typically banner ads.
- Social: traffic from social media channels such as Facebook, Twitter, Pinterest and more. Also includes traffic from paid social campaigns and third party tools, such as Hootsuite and Tweetdeck.
- Email: Traffic sent to your site from your email campaigns.
- (Other): Google places traffic it can’t identify into this bucket.
Warning: The traffic report isn’t flawless. It gives you a great overview of where traffic is coming from but the numbers might not be 100% accurate.
For instance, Direct Traffic is typically a "miscellaneous" channel when Google can’t determine where the traffic really came from. For instance, if your Direct Traffic skyrockets one month, there’s a good chance it came from a campaign that lost the tracking code.
Discovering which search terms drive traffic
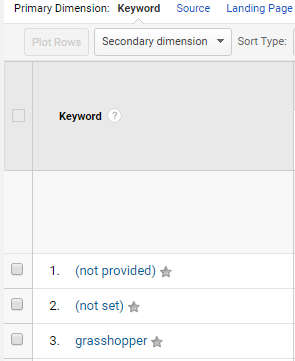
In addition to discovering which channels send you traffic, it’s also important to find out which keywords or phrases users are searching to get to your content. To do this, simply repeat the steps to get to the traffic channel overview, then click into Organic Search. You’ll then see the traffic broken down by the search terms, phrases, or URLs users typed into the search engine to get to your site.

Unfortunately, the top results will most likely say "(not provided)" or "(not set)".
- (not provided): the visitor came to your site typing in a search term on a secure webpage. For privacy reasons, the search term isn’t passed on.
- (not set): Google doesn’t have any information on the search term. This typically happens when a visitor is redirected to a page.
Additional reading:
- Direct Traffic in Google Analytics | Google
Engagement
Traffic numbers are important to understand how visitors are getting to your site; but engagement metrics help you understand how visitors are interacting with your site. Important engagement metrics to understand include:
- Bounce Rate: the percentage of visitors who come to your website and leave without visiting another page. A low bounce rate indicates that the content on your site is keeping visitors engaged.
- Avg. Session Duration: a ball park timeframe of how long a visitor stays on your website. A high average indicates that you had a good amount of visitors who stayed on your site.
- Time on Page: similar to session duration, however, it only measures session duration for a single page – not the total visit duration. This is a good metric for evaluating how engaging a single piece of content is.
Below, we explain a few ways to find out who your customers are and what they like most on your site.
Discovering top pages
To discover which pages are driving the most page views (not sessions) follow these steps from your dashboard:
- Behavior
- Site Content
- All Pages
Here you will get a very basic overview of your top pages, which means the pages that get loaded most on your site.
To dive deeper into these metrics, check out: Google Analytics Content Reports: Understanding the Key Benefits
Understanding where your visitors are coming from
Discovering where your visitors are coming from will help you plan your marketing efforts; you’ll have a better understanding of who your audience is and therefore plan email and social campaigns better. For instance, if the majority of your visitors live on the West Coast, perhaps scheduling your email campaigns at 10AM EST on Tuesdays is not as effective as you thought.
It’s also helpful for planning your content strategy. For example, a Boston-based yoga studio might have a blog with the intention of attracting foot traffic to their business. However, if it’s a well-done blog, it could attract website visitors from all around the country. Use that to your advantage.
One way is to include a content piece angled toward those readers. For instance, if the Boston Red Sox are about to play the LA Angels, a studio owner could write a timely blog post on "Don’t Stress: Breathing Techniques for when Your Team Plays the Red Sox". This way, the next time a West Coast yogi is in Boston, there’s a good chance they’ll keep this studio in mind.

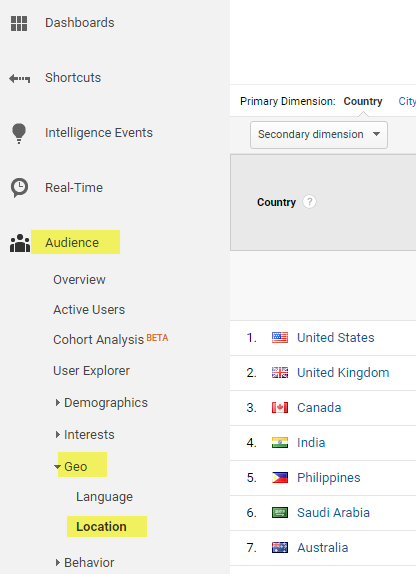
Steps to find out where your visitors are located. From your dashboard:
- Audience
- Geo
- Location
You have the ability to dive deeper by simply clicking the country. Click a few more times and you can discover the city. You also have the option to switch from City to Metro location below the map.

Customizing Your Google Analytics
As you get more familiar with Google Analytics, you’ll most likely find that there are a few things you would like to personalize even more. Well, you can with the use of filters, advanced segments, shortcuts and customized reports.
Filters
Filters are a helpful tool for cleaning up your traffic data. Sometimes your traffic overview can be misleading and include visits from internal referrals, for instance. With filters, you can clean up that data by excluding specific IP addresses.
To find out what other filters you can create, check out this great guide from LunaMetrics: Basic Google Analytics Filters for Every Site
Advanced Segments
An advanced segment is an invaluable tool for isolating the traffic data you want to look at. For instance, you can create segments for different content types, mobile devices, campaigns and more. By creating segments, you’ll get a clearer picture of how different sections of your site are performing.
Start playing around with advanced segments outlined in these helpful guides:
- Why You Should Use Advanced Segments in Google Analytics | Simple Analytics
- How to use (Advanced) Segments in Google Analytics | Smart Insights
Customized Reports
A custom report is exactly what it sounds like: a report you create from the bottom up that displays the metrics and data you’re interested in. There are a few limitations as to which metrics and dimensions you can select but for the most part, a custom report is yours to design.
Recommended reading:
- 12 Google Analytics Custom Reports to Help You Grow Faster | CXL Institute
- 12 Awesome Custom Google Analytics Reports Created by the Experts | Kissmetrics
Shortcuts
This feature simply saves you from clicking around and creating the same reports again and again. By creating a shortcut, you’re simply bookmarking a report to your dashboard view, so it’s already there when you sign on. Very helpful for reports you look at daily.
Recommended reading:
- Report Shortcuts | Google Analytics
In Summary
Google Analytics is a vital tool for understanding how your website performs, who your visitors are and how your business is growing. It might seem overwhelming at first but once you master it you’ll be able to make decisions that will take your business to the next level.


Talk about this lesson